Visual Strategic Forecasting

Visual Modeling for Life Sciences

Introducing Foresight Studio™, the premier strategic forecasting and financial modeling platform for pharmaceutical, medical device and diagnostics opportunity analyses.

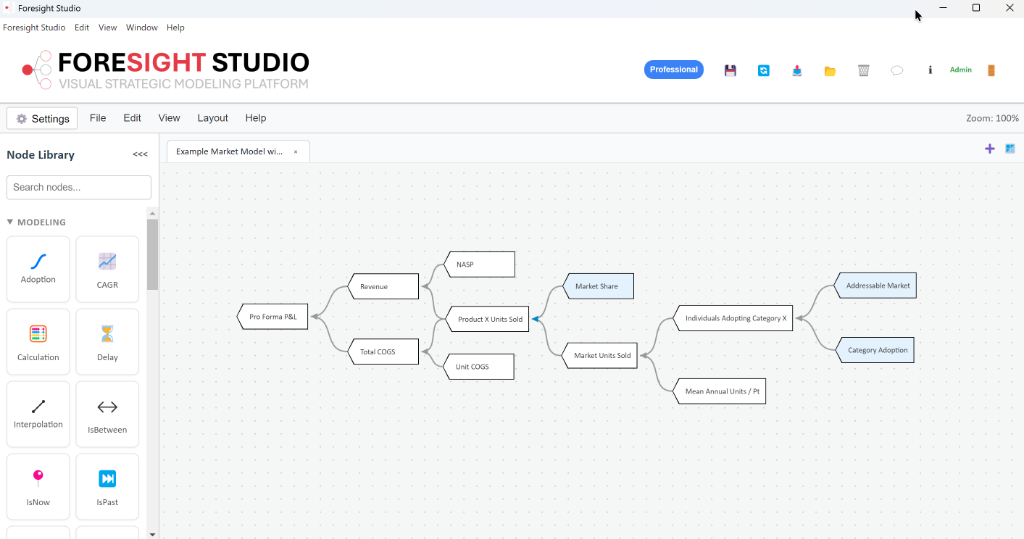
foresight_studio_canvas
Foresight Studio Node Canvas

About Foresight Studio

Foresight Studio is built around some simple, but fundamental premises

🧩

Complex dynamics can (and should) be represented simply.

🖼️

A picture is worth a thousand words (or rows in a spreadsheet).

🔍

Transparency is an imperative.

🎲

Uncertainty is everywhere; ignore it at your own peril!

Key Product Features

Foresight Studio is a local-first, interactive visual modeling platform designed for finance, product, strategy, and engineering teams to build, simulate, and analyze complex market models.

01

Interactive Visual Modeling Canvas

  • No-Code Visual Workflows: Build complex financial and forecasting models visually using a drag-and-drop node graph instead of writing messy, error-prone spreadsheet formulas.
  • Modular Architecture: Connect modular nodes (Inputs, CAGR, Diffusion curves, logic Switches, and P&L Statements) to establish dependencies and map data flows.
  • Multi-Region Modeling: Link independent sub-models (e.g. region-specific adoption curves) to a master dashboard model, enabling highly organized, large-scale forecasting.
02

Advanced Probability & Simulation Engine

  • Monte Carlo Distributions: Run statistical simulations to model real-world uncertainty, market fluctuations, and clinical trial outcomes rather than relying on static single-point estimates.
  • Real-time Sensitivity Analysis: Execute parameter sweeps to instantly identify which variables (e.g. churn rate, acquisition cost) have the highest impact on your business outcomes.
  • Multi-Scenario Sandboxing: Toggle between different logic states, switches, and assumptions non-destructively to test "what-if" business scenarios side-by-side.
03

Reusable Template & Model Library

  • Industry Templates: Instantly inject pre-built models to kickstart your drug, device, or market assessments.
  • Custom Template Creation: Save your custom-designed canvas structures as reusable templates, allowing team members to clone complex sub-systems in a single click.
  • Dynamic Port Connections: When applying templates, all input and output ports wire themselves up automatically to preserve your data structure.
04

Real-Time Interactive Dashboards

  • Dynamic Charting: Present forecasts instantly using interactive charts (adoption curves, P&L statements, and probability distributions) powered by a real-time computation server.
  • Instant Variable Adjustments: Change assumptions and inputs on the sidebar and watch the entire visual graph and charts recalculate instantly.
  • Export & Share: Export reports as MS Excel files. Save models locally as clean JSON files or publish them securely to the server library for distribution.
05

Enterprise-Grade Security & Local-First Speed

  • Local-First Privacy: All computational modeling, sandboxing, and draft saving happen locally on your computer—sensitive financial and intellectual property never leaves your local machine.
  • Fast Computation: Computation tasks run inside highly optimized sandboxed virtual machines locally on your device for sub-second calculation loops.